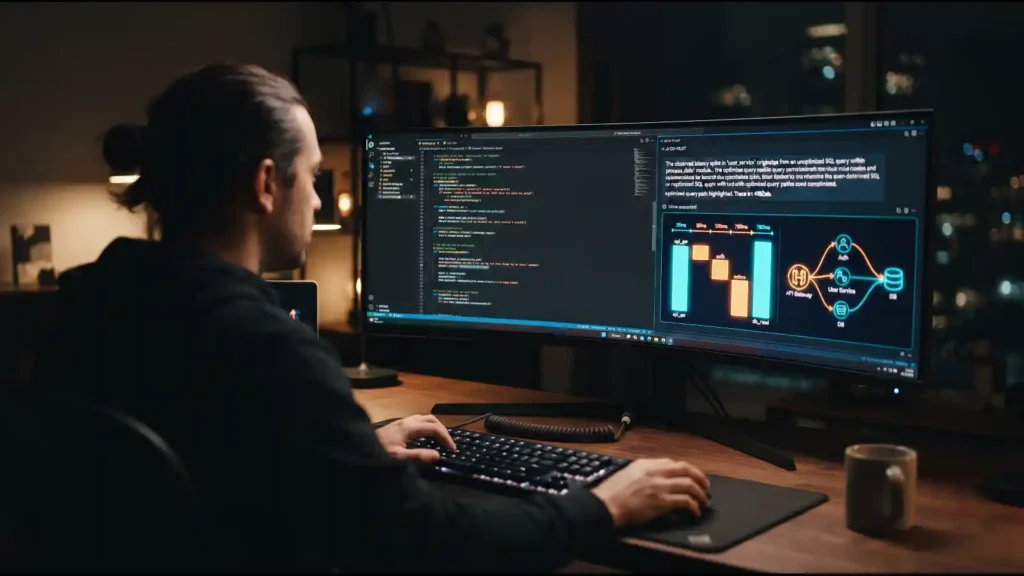
Amazon OpenSearch Service now supports MCP Apps, a feature that pairs every AI agent response with an interactive visualization rendered in the same chat window. Instead of reading a text summary and then opening a browser to confirm it, engineers using a compatible agentic IDE can now see the trace waterfall, service map, or log pattern that backs up the agent's answer, in place, without switching tools.
The feature targets a specific gap in agentic incident response: agents are already fast at querying alerts, correlating logs and traces, and proposing a root cause. What has stayed manual is verification, the step where an engineer checks the agent's claim against the actual dashboards. AWS built MCP Apps, an extension of the open Model Context Protocol, to close that gap by returning a dual response from every tool call, a concise summary for the agent to reason over and a rendered visualization for the human to check.
The capability runs through a single, locally run MCP server that connects to data already stored in OpenSearch domains, OpenSearch collections, and Amazon Managed Service for Prometheus, and it works inside MCP-compatible hosts such as Claude Desktop and VS Code.
What Amazon OpenSearch Service MCP Apps Actually Do
MCP Apps extend the Model Context Protocol so a single tool call can return two things at once: a compact text explanation the agent uses to keep reasoning, and an interactive visualization the engineer uses to verify it. Instead of an agent describing a trace in prose, it can hand back the actual trace waterfall, service topology, or log pattern view, rendered directly in the conversation.
That matters because the slow part of agent-assisted debugging was rarely the querying. It was the loop that came after: read the agent's text answer, open a separate observability UI in a browser, re-run the query by hand, compare the two, then go back to the agent. MCP Apps collapse that loop into one thread, so the alert-to-trace-to-logs-to-root-cause path can happen without a tab switch.
How Does the Setup Work?
To use the feature, you need an OpenSearch UI application with an Observability workspace connected to at least one data source, which can be an OpenSearch domain, an OpenSearch collection, or Amazon Managed Service for Prometheus. AWS credentials configured with es:ESHttpGet and es:ESHttpPost permissions are required so the local MCP server can query your telemetry. Once the server is running and connected to a supported agentic IDE, tool calls for alerts, traces, service maps, and PromQL metric charts start returning visual results alongside text.
What Can You Investigate With It?
AWS lists several MCP Apps available at launch, covering the core stages of an incident investigation:
- Alerts – view and triage firing alerts across connected data sources
- Traces – inspect distributed traces and trace waterfalls
- Service maps – see service topology and scope the blast radius of an issue
- Metrics – review PromQL-based metric charts from Amazon Managed Service for Prometheus
- Log patterns – surface recurring log patterns tied to an incident
Each of these is described as a composable unit, a single observability job an agent can call as part of a longer investigation, rather than one monolithic dashboard.
How Does This Compare to the Existing OpenSearch Observability Workflow?
OpenSearch already offers a webpage-based observability experience for logs, traces, metrics, and alerts. MCP Apps don't replace that; AWS describes it as an augmentation that brings the same underlying data into the IDE where an engineer is already working.
The underlying data sources, permissions model, and OpenSearch UI itself are unchanged. What's new is where and how the results surface.
Where Does This Fit Into the Broader Agentic Tooling Trend?
This release lands alongside a broader push across the AWS ecosystem to give agents governed, verifiable access to enterprise systems. AWS has also published a maturity model for controlling how agents reach internal tools through Bedrock AgentCore Gateway, and separately released a sample voice-agent architecture in its Amazon Connect telephony work. The common thread across these releases is less about giving agents more autonomy and more about giving humans faster ways to check what the agent did. That emphasis on verification is notable given how much of the current conversation about enterprise agentic AI adoption centers on trust and governance gaps rather than raw capability.
What Are the Limitations?
A few practical constraints are worth flagging. MCP Apps require a locally run MCP server and a compatible agentic IDE, so it's not a feature you get automatically inside the standard OpenSearch UI. Availability is scoped to AWS Regions where the Amazon OpenSearch UI is offered, and the underlying data still has to already be flowing into OpenSearch domains, collections, or Amazon Managed Service for Prometheus for there to be anything to visualize. AWS has not published pricing specific to MCP Apps separate from standard OpenSearch Service usage.
Key Takeaways
- Amazon OpenSearch Service MCP Apps return an interactive visualization alongside every agent text response, inside the same chat thread.
- The feature runs through a locally hosted MCP server and works in compatible agentic IDEs, including Claude Desktop and VS Code.
- Available MCP Apps at launch cover alerts, traces, service maps, PromQL metrics, and log patterns.
- It augments, rather than replaces, OpenSearch's existing webpage-based observability UI.
Key Takeaways
- MCP Apps pair every agent response with an interactive visualization in the same chat window, so engineers can verify findings without switching to a browser.
- The feature runs through a single, locally hosted MCP server connected to OpenSearch domains, collections, or Amazon Managed Service for Prometheus.
- Launch coverage includes alerts, distributed traces, service maps, PromQL metric charts, and log patterns.
- It's available in AWS Regions where the Amazon OpenSearch UI is offered, and it augments rather than replaces the existing observability UI.
FAQ
What are the best agentic AI observability tools?
There's no single official ranking, but the category generally includes cloud-native options like Amazon OpenSearch Service (now with MCP Apps), plus platforms such as Datadog, Grafana/Prometheus-based stacks, New Relic, and specialized agent-monitoring vendors like Fiddler and Arize. Most differ on how deeply they integrate with an agent's tool calls versus offering observability as a separate dashboard you check manually.
What are the top 3 observability tools?
This varies by use case and isn't governed by an authoritative benchmark, but the tools most commonly cited in enterprise observability discussions are Datadog, the Prometheus/Grafana open-source stack, and Amazon OpenSearch Service, each with different strengths around cost, self-hosting, and native cloud integration.
Is ChatGPT an agent or LLM?
ChatGPT is built on a large language model (LLM), but in its current product form it can also act as an agent when it uses tools, browses, or takes multi-step actions on a user's behalf. Whether a given interaction counts as 'just an LLM' or 'agentic' depends on whether it's reasoning over text alone or actively calling tools and taking actions.
What are the top 3 AI agents?
There isn't an official top-3 list, since 'AI agent' spans coding agents, customer-support agents, and infrastructure agents like the one described in this OpenSearch release. Widely discussed examples in 2026 include coding-focused agents (such as those built on Claude and GPT models), enterprise workflow agents built on frameworks like AWS AgentCore, and observability agents like the one covered here.