
A new preprint posted to arXiv puts a spotlight on AI benchmark duplicate rows, arguing they are quietly distorting how anomaly detection models get scored. The paper, titled “When Identical Rows Disagree: From Benchmark Identifiability to Replication-Robust Anomaly Detection,” says benchmark tables are routinely treated as clean, independent samples when in reality they often are not, according to the preprint.
That distinction matters because it determines how a benchmark score should be read. If a set of near identical rows gets counted as separate, independent data points, a detection model’s accuracy can look more reliable than it actually is, and every study that leans on that benchmark inherits the same distortion without knowing it is there.
What the Preprint Says About AI Benchmark Duplicate Rows
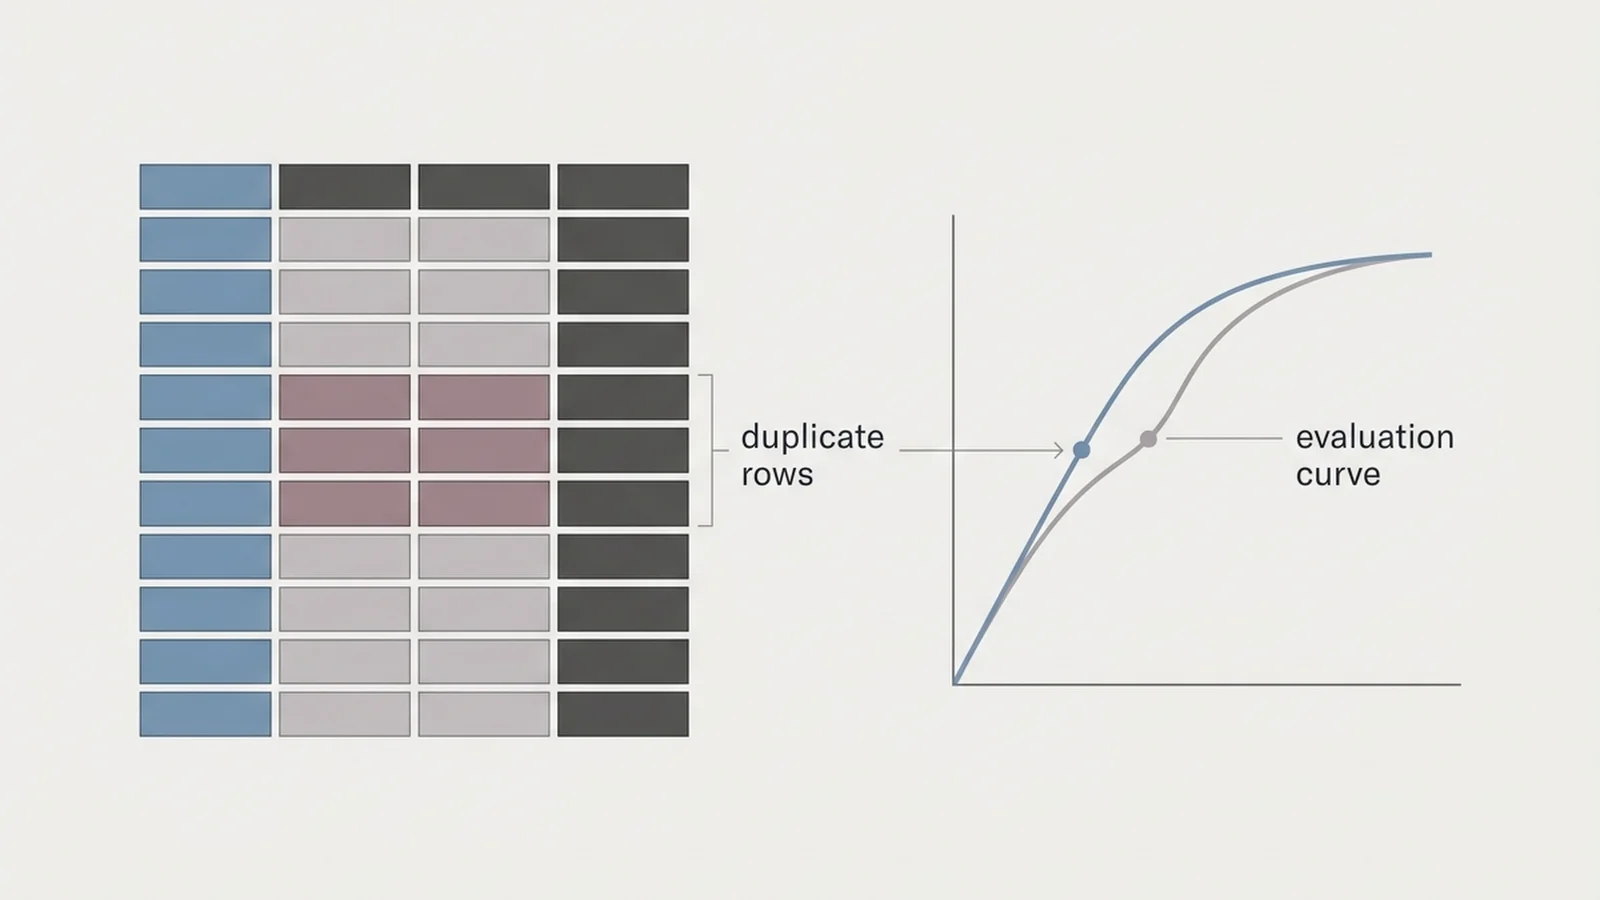
The core claim is straightforward: repeated rows in a benchmark dataset are not always noise. According to the preprint, duplication can encode real signal, such as how often a particular type of business transaction or entity actually occurs, the result of joining multiple data tables together, deliberate resampling, or plain extraction errors. Treating all of that as if it were a random, independent sample is where the trouble starts.
The authors describe three specific consequences that follow from ignoring this. When rows are feature identical, meaning they look the same to a model even if they came from different sources, they impose what the paper calls an attained evaluation ceiling, a limit on how high or low a score can realistically go regardless of how good the underlying model is. A common evaluation metric called AUROC, used to grade how well a model separates normal data from anomalies, turns out to be sensitive to how many times a row is replicated in the dataset. Detectors trained directly on these datasets can learn what the authors term a multiplicity size biased law, meaning the model’s behavior ends up shaped by how often certain rows repeat rather than by the underlying pattern it is supposed to be learning.
| Reported issue | What it means for a benchmark score |
|---|---|
| Feature identical rows | Create an attained evaluation ceiling that caps how meaningful a score can be |
| AUROC sensitivity | The common accuracy metric shifts based on how many times a row is duplicated |
| Multiplicity size bias | Models trained on the data learn patterns tied to repetition rather than genuine anomalies |
Why Anomaly Detection Benchmarks Are Easy to Get Wrong
Benchmark contamination is not a new problem in machine learning, but this preprint focuses on a narrower and less discussed version of it: duplication within a single dataset rather than overlap between separately sourced training and test sets. Anomaly detection benchmarks, the kind used to test whether a model can flag unusual transactions, sensor readings, or network activity, are built by compiling real world records into a fixed set of tables. Those tables inherit whatever irregularities existed in the source data, including entries that repeat for entirely mundane reasons such as a recurring customer or a frequently logged event type. OddBench, the benchmark suite examined in the preprint, is described in available coverage only as a collection of 690 datasets used for this kind of evaluation. No further detail about who maintains it or how it was assembled appears in current reporting.
To test this, the authors ran what they call an exact row audit across all 690 OddBench datasets, checking each one for identical rows. Available coverage of the paper stops short of reporting what that audit actually found, so the specific rate of duplication across those 690 datasets is not yet known outside the full paper itself.
Why It Matters for Anomaly Detection Research
If the paper’s argument holds, some published benchmark results in anomaly detection may be less meaningful than they appear. Researchers who cite a high AUROC score as evidence that a detection model works well are, in effect, trusting that the underlying dataset behaves like a clean random sample. This preprint argues that assumption often does not hold, and that the gap between the two can inflate or otherwise distort a model’s reported performance without anyone doing anything intentionally wrong.
The practical stakes fall hardest on teams using these benchmarks to decide which anomaly detection approach to deploy, whether that is fraud detection, network security monitoring, or industrial sensor analysis. A model that looks best on a contaminated benchmark is not necessarily the model that performs best once it hits production data that was never pre-filtered into a fixed set of test rows. The same instinct applies elsewhere in AI coverage this week: growth claims around products like Meta’s Muse also rest on qualitative statements that lack independently verified numbers, a pattern worth watching whenever a headline figure is not backed by a released dataset or audit.
What’s Confirmed and What Isn’t
What is confirmed, based on the preprint itself, is the argument and the three consequences it names, along with the fact that an exact row audit was run across all 690 OddBench datasets. What is not confirmed in the coverage available is any specific number: no percentage of duplicated rows, no ranking of which datasets were worst affected, and no quantified effect on reported AUROC scores has been reported. It is also worth repeating that this is a preprint. It has not gone through peer review, and no outside researchers have yet weighed in publicly on whether its methodology holds up.
What to Watch Next
The next real test for this work is peer review and replication. If other researchers rerun the exact row audit against OddBench or apply the same method to other anomaly detection benchmarks, that will show whether the problem the paper describes is isolated or widespread. Anyone building or evaluating anomaly detection systems on OddBench in the meantime has reason to ask how many of their benchmark’s rows are exact duplicates before trusting a leaderboard score at face value.
Frequently asked questions
What does benchmark identifiability mean in this paper?
It refers to whether individual rows in a benchmark dataset can be treated as distinct, independent data points. The preprint argues that many rows in benchmark tables are not truly independent because they repeat due to real world frequency, database joins, resampling, or extraction errors, which complicates how scores from that benchmark should be interpreted.
What is OddBench?
OddBench is the benchmark suite examined in the preprint, described in available coverage as a collection of 690 datasets used to evaluate anomaly detection models. Current reporting does not provide further detail on who maintains OddBench or how its datasets were originally compiled.
How can duplicate rows affect an AUROC score?
AUROC is a common metric used to judge how well a model separates normal data from anomalies. According to the preprint, this metric is sensitive to how many times a given row is duplicated within a dataset, meaning a reported score can shift based on repetition rather than genuine model performance.
Has this research been peer reviewed?
No. The paper is currently available only as a preprint in arXiv’s cs.LG listings. It has not gone through formal peer review, and available coverage does not include commentary from outside researchers evaluating its methodology or conclusions.
Did the audit find a specific rate of duplication in OddBench?
Available coverage of the preprint does not report a specific percentage or count of duplicated rows found across the 690 OddBench datasets. The audit itself is confirmed, but its detailed numeric results are not included in current reporting.